So, my wife and I are expecting a baby! And I was showing my parents our sonogram the other day:
… when my mother mentioned that when she was pregnant with me, she didn't have a sonogram. So there are officially no pre-birth pictures of me. For some reason, this totally surprised me. Having never actively thought about sonograms before, and because they are so strongly associated with pregnancy in TV and movies, I think I subconsciously thought they always existed. Or at least, that they were invented in the 1920s or something. (I think I was confusing them with X-rays.) Turns out, as you can read
here and
here, medical sonography was invented in the late 1940s but was not used for pregnancies until the 1970s. Now, it's so common and easy that my wife and I already have 16 pictures of our baby on the fridge, and she's only just started her second trimester. We already have almost as many photos of my child before its birth than I have of the first few years of my life or my father has of practically his entire childhood.
This is just one of the many advances that adds up to the lowest infant mortality rate in history. Take a look at this chart from
The Secret Peace:
The scale on the left is infants per 1,000. So if we look at 1977 (the year I was born), we see an infant mortality rate of about 20 per 1,000 (or 2 percent) in developed countries. Today, that's down to less than 10 (1 percent). The drop in developing countries happened at a similar rate: from about 95 to almost 50 (9.5 percent down to 5 percent). Obviously there is still a huge gap between developed and developing countries, but you can see where the trend is quickly headed.
In the couple years since I did the above research and published the book, more data resources are available online. Here's an
article about a specific case study on Niger, which reduced its child mortality (which means children under 5 years, slightly different than infant mortality) nearly in half from 226 (22.6 percent) in 1998 to 128 (12.8 percent) in 2009. And the ever-excellent
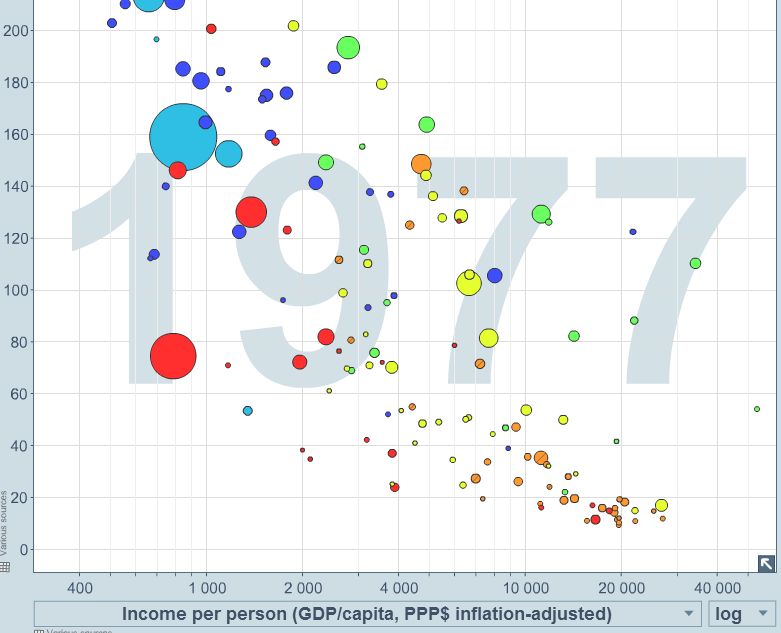
Gapminder shows this chart, which, if you hit "Play" on the bottom, lets you see the trend from 1950 to today for every single country at once! You can watch all the countries drop over time towards a better rate (and increase in wealth, which is also shown on the chart). In the earlier years, many of the countries have such a high rate that they are literally off the chart.
By the way, here are two opposite points of reference: the lowest rate in the world today is Iceland, which loses only three infants per 1,000. That's .3 percent. On the other hand, for most of human history until about the 19th century, the entire world had an infant mortality rate of around 250 per 1,000. This means one out of every four babies died in their first year. Since my wife and I are experiencing a pregnancy firsthand now, I can start to fathom what a horrible tragedy that must have been for everyone - nearly all parents lost children - as well as what a colossal drain of resources and human endeavor.
At first glance, our great success in decreasing infant mortality would seem to have a terrible side effect: too many people. We've all heard about the threat of overpopulation and what a drain we all are on the earth's resources. Luckily - surprisingly - fertility rates have been decreasing simultaneously.
This chart is from this
cool page of infographics. The decrease in fertility rates is happening for many reasons, but one is a consequence of the decrease in infant mortality: the logic that if your child is more likely to survive and thrive, you don't need to have as many to get the same result (a child surviving to adulthood.)
So, all in all, it's a good time to be a baby. And personally, we can't wait to introduce our upcoming little one to a world that while very imperfect, continues inexorably to improve.